

kt-connect 联调
一. k8s调试工具kt-connect介绍
1. 简介
kt-connect是阿里开源的k8s的调试工具,它的作用类似于VPN,能够打通k8s集群和本地的网络,让开发测试人员可以直接在本地访问k8s里的pod和service等资源。
2. 工作模式
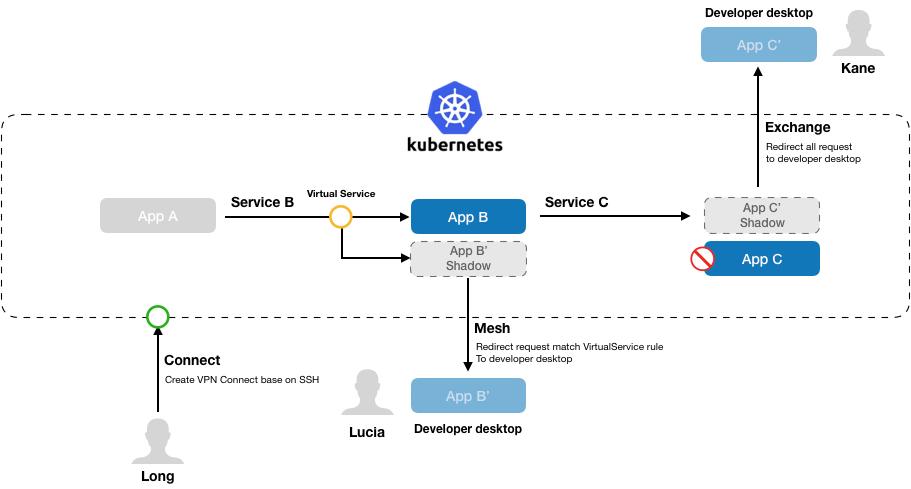
kt-connect有3种模式:
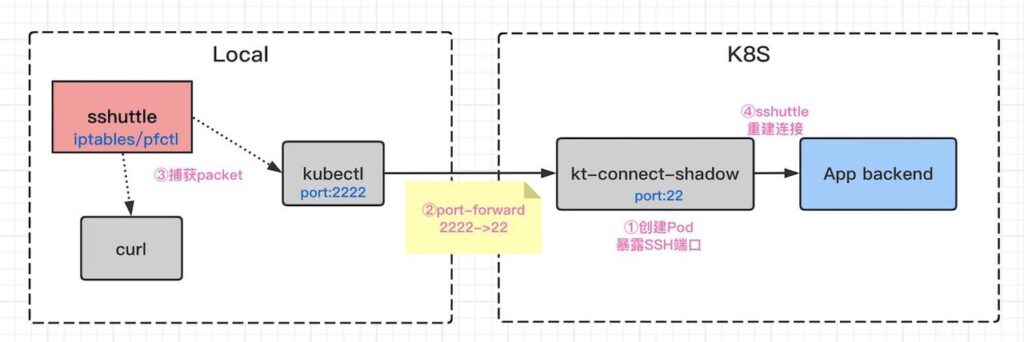
* Connect 本地网络直接访问k8s集群网络
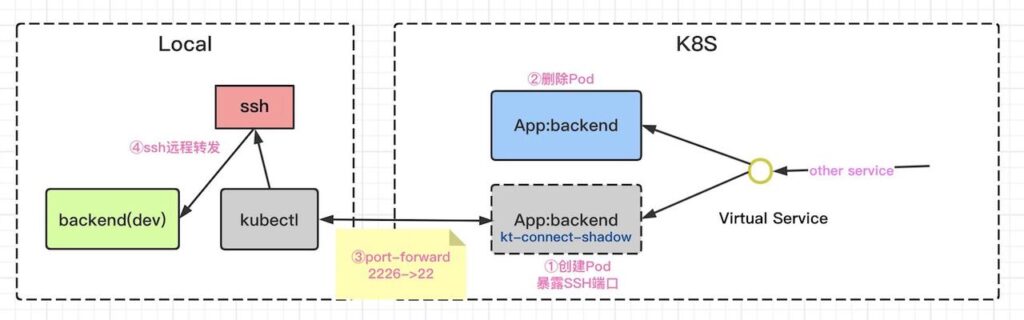
* Exchange 转发集群流量到本地
* Service Mesh 支持
二. Download And Install
MacOS
brew install kt-connect三. 访问
1. 在本地使用 Connect模式连接k8s集群
% sudo ktctl connect
Password:
8:26PM INF Using cluster context arn:aws:eks:ap-east-1:<ACCOUNT>:cluster/my-eks (arn:aws:eks:ap-east-1:<ACCOUNT>:cluster/my-eks)
8:26PM INF KtConnect 0.3.7 start at 66785 (darwin arm64)
8:26PM INF Fetching cluster time ...
8:26PM INF Using tun2socks mode
8:26PM INF Successful create config map kt-connect-shadow-lgsan
8:26PM INF Deploying shadow pod kt-connect-shadow-lgsan in namespace default
8:26PM INF Waiting for pod kt-connect-shadow-lgsan ...
8:26PM INF Pod kt-connect-shadow-lgsan is ready
8:26PM INF Port forward local:28758 -> pod kt-connect-shadow-lgsan:22 established
8:26PM INF Socks proxy established
8:26PM INF Tun device utun3 is ready
8:26PM INF Adding route to 10.100.0.0/16
8:26PM INF Adding route to 172.20.0.0/16
8:26PM INF Route to tun device completed
8:26PM INF Setting up dns in local mode
8:26PM INF Port forward local:41822 -> pod kt-connect-shadow-lgsan:53 established
8:26PM INF Setup local DNS with upstream [tcp:127.0.0.1:41822 udp:223.5.5.5:53]
8:26PM INF Creating udp dns on port 10053
8:26PM INF ---------------------------------------------------------------
8:26PM INF  All looks good, now you can access to resources in the kubernetes cluster
8:26PM INF ---------------------------------------------------------------
2. 直接在本地访问services ip
在dashboard中找到对应服务的IP
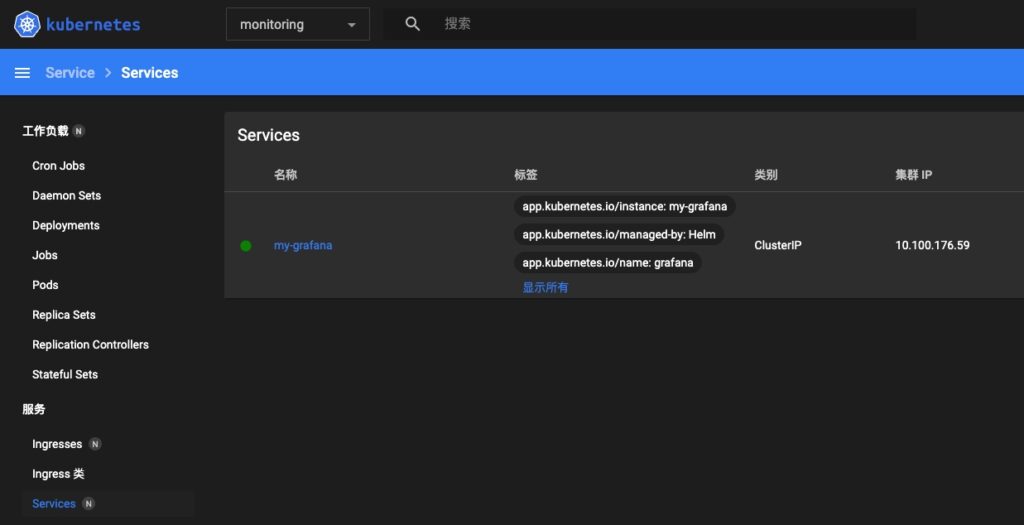
直接访问服务的ip地址
% ping 10.100.176.59
PING 10.100.176.59 (10.100.176.59): 56 data bytes
64 bytes from 10.100.176.59: icmp_seq=0 ttl=64 time=0.362 ms
64 bytes from 10.100.176.59: icmp_seq=1 ttl=64 time=0.658 ms
64 bytes from 10.100.176.59: icmp_seq=2 ttl=64 time=0.445 ms
64 bytes from 10.100.176.59: icmp_seq=3 ttl=64 time=0.518 ms
64 bytes from 10.100.176.59: icmp_seq=4 ttl=64 time=0.520 ms
3. 通过services域名访问
% ping my-grafana.monitoring.svc.cluster.local.
PING my-grafana.monitoring.svc.cluster.local (10.100.176.59): 56 data bytes
64 bytes from 10.100.176.59: icmp_seq=0 ttl=64 time=0.451 ms
64 bytes from 10.100.176.59: icmp_seq=1 ttl=64 time=0.420 ms
留言